What Are the Top Supply Chain KPIs to Measure Today?
The supply chain refers to all activities involved in converting raw materials to finished products and getting the finished products to the final consumer, forming a vital cog in the business wheel. A successful business depends on the success or efficiency of its supply chain. Thus, the need to constantly monitor the various supply chain stages, from raw material sourcing to delivery to the final consumer, ensuring smooth operations for maximum returns.
To achieve this, you need to constantly measure the performance of your supply chain using various Key Performance Indicators (KPIs). For instance, a shipping line from China to UAE is most likely to measure the speed of delivery as a KPI while a retail store measures the number of cash sales or customer service as a crucial aspect of the business that success relies on.
Thus, supply chain KPIs are a set of measurable metrics that tell you about the efficiency of your supply chain over a while and help you identify the weak areas of the supply chain where improvement is needed for better performance. They also help monitor the overall business efficiency in cost, value service, and waste generated and measure the progress in achieving its goals. Thus, the importance of KPI in supply chain.
There are several KPIs that a company can choose to measure depending on the crucial aspects of the business that it focuses on. This article will expose you to some top KPIs common among businesses and industries that can be used to measure supply chain efficiency.
Top supply chain KPIs to focus on
Supply chain KPIs are measures of supply chain performance, helping improve business productivity and customer satisfaction. The following are top supply chain performance metrics that aid supply chain managers measure and work towards achieving these objectives.
Perfect order
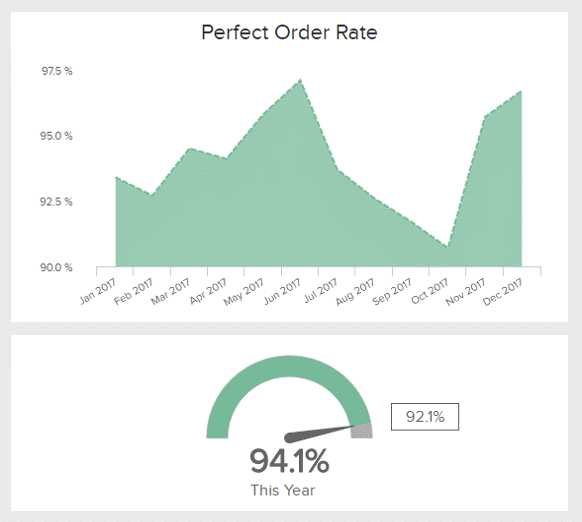
Copyright: www.datapine.com
This is crucial to measuring supply chain efficiency and comprises various other smaller metrics. It also gives you an insight into the efficiency of your order fulfillment and helps track storage and delivery options, as well as cost and customer satisfaction. Perfect order comprises
- On-time delivery: A measure of the percentage of delivery that got to the customer at the desired time
- In-full delivery: A percentage of the correct delivery made to the right customer
- Damage-free delivery: This calculates the ratio of goods delivered to the customer in good condition, without any damage.
- Accurate documentation: This gives an insight into the percentage of deliveries made with correct documentation such as invoices, packing lists, labels, etc.
A low value for these KPIs depicts low customer satisfaction, which can lead to loss of sales and poor business yields. In addition, it also gives an insight into the cost incurred by inefficient order fulfillment. The formula for calculating perfect order is
[(total number of orders – number of orders with errors)/ total number of orders] x 100
- The number of orders with errors can be any of the four smaller components of perfect order KPI.
Cash to cash time cycle
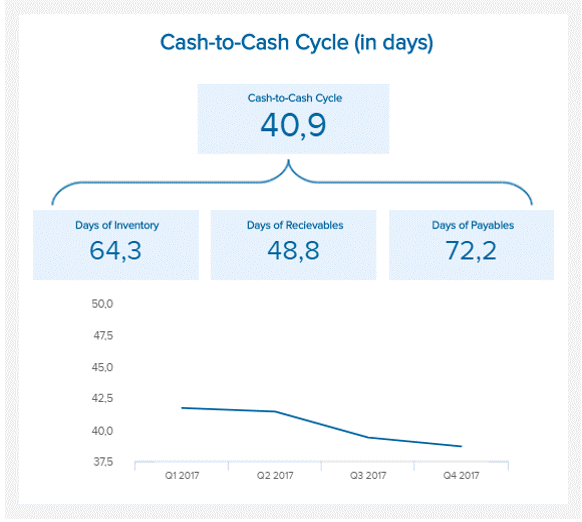
Copyright: www.datapine.com
This measures the time it takes to receive cash for an inventory purchased. It is the time between when you pay for inventory and when you receive money from the sales of that inventory or the time taken to convert resources to cash flows. A low figure for this KPI means that your inventory doesn’t spend much time in your warehouse before selling them and is great for the business.
On the other hand, a high value means that goods are spending too much time in the warehouse and can be improved by better forecasting and stocking faster-selling goods. Although this metric seems more like a financial one, it is a vital tool for determining your supply chain efficiency. The formula for calculating cash to cash cycle is
Inventory outstanding days + Sales outstanding days – Payables outstanding days
Freight Bill Accuracy
This is essential to measure the accuracy of shipments from the supplier and to the end customers. Shipping is a critical part of business logistics and must be carried out with utmost precision as a slight error can affect business profitability and lead to poor customer experience. Therefore, the need to maintain billing accuracy in the supply chain.
Tracking this KPI will help you identify negative trends in billing accuracy, helping you improve this metric and increase business profitability and growth. The formula for this KPI is
(Error-free bills – total number of bills) x 100
Inventory turnover
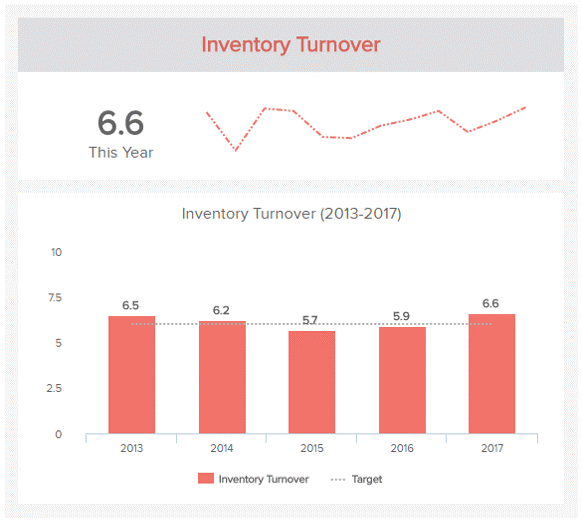
Copyright: www.datapine.com
This KPI gives an idea of the frequency of selling your entire inventory over a given period. A high value for this KPI indicates efficiency in production planning, fulfillment abilities, sales and marketing strategy, and process strategy. Calculating this KPI will also give you an idea of where you stand among your competitors when you compare your value with theirs.
Inventory turnover measures the efficiency with which you turn your working capital into business profits, and you can improve this KPI by working on your sales and marketing strategy and other areas of your business that affects your business turnover such as fulfillment operations and production processes. The formula for this KPI is
Cost of goods sold/ [(Opening stock – Closing stock)/2]
Inventory velocity
This is a measure of the speed at which inventory is sold. It shows how much inventory is expected to be sold during a given period and how much inventory is left, facilitating better inventory planning and management. A good value for this KPI signifies optimized warehouse operations and inventory planning and helps reduce the risk of overstocking and outdated inventory while also increasing customer satisfaction.
Inventory can be classified as fast-moving (75% – 80%), slow-moving (< 60%), or continuously-moving (60% – 70%) items according to their inventory velocity determined by monthly sales, the number of items leftover in the warehouse, or margin percentage. This will help you identify goods that sell fast and invest more in them.
The formula for this KPI is (Opening stock/ Next period’s Sales Forecast)
Conclusion
No matter the nature of the business, all businesses in the manufacturing industry have a common feature of receiving raw materials and processing them into finished goods delivered to the customer. As such, the need for an efficient supply chain system to manage the supply chain operations optimally. Identifying various KPIs critical to business performance and measuring them will help achieve this efficiency.
Organizations can also employ executive dashboards that use various supply chain metrics to provide real-time information that can help in decision-making. Whether calculated manually or with the use of executive dashboards, keeping track of these KPIs and many others is critical to ensuring supply chain efficiency and ultimately business success and profitability.
*This article is written by Danielle Gregory. Danielle is a writer and marketing expert who is currently working for QAFILA. Danielle’s writing relates to a range of subjects such as logistics and IoT. Besides writing, she enjoys traveling, cooking, and riding.