Overcome Mucking Blockages with Distance Charting
The movement of broken rock or “muck” is critical in an underground mining operation. A large portion of mine design is based around getting the muck from the blast area to the surface. This intricate design involves many different methods including LHD (Load Haul Dump) machines, haul trucks, shaft skips, railcars, conveyors, and gravity fed muck passes. In many cases, all of the mentioned methods may be used in conjunction to form the muck system of an underground mine.
The objective of this muck system is to bring an inherently heavy substance (solid rock/ore), upwards in most cases, with as little effort as possible. Regardless of the methods your underground mine is utilizing to bring the muck to the surface, there are typically a limited number of routes to the surface because of the capital expenditure involved in creating exit points. As a result of this, there is a large impact to operations if one of these routes becomes blocked. A blockage may occur for several reasons: critical equipment failure, path blockage by other equipment, or pure congestion in the area. When this situation occurs, depending on where it occurs in the muck system, the muck will eventually back up to the source or where the mining activity is happening. A critical delay known as being “muck bound” occurs when blasting activities must cease to take place because there is nowhere to put the muck. The miners may be allocated to another location; however, that specific location will remain idle until the blockage is corrected. If this situation occurs in a high-grade area of the mine, it can be very costly to operations. With most other methods of moving muck relying only on proper maintenance and operation, the mobile LHD and haul truck operations provide a variable link between the active mining area and the muck system (below).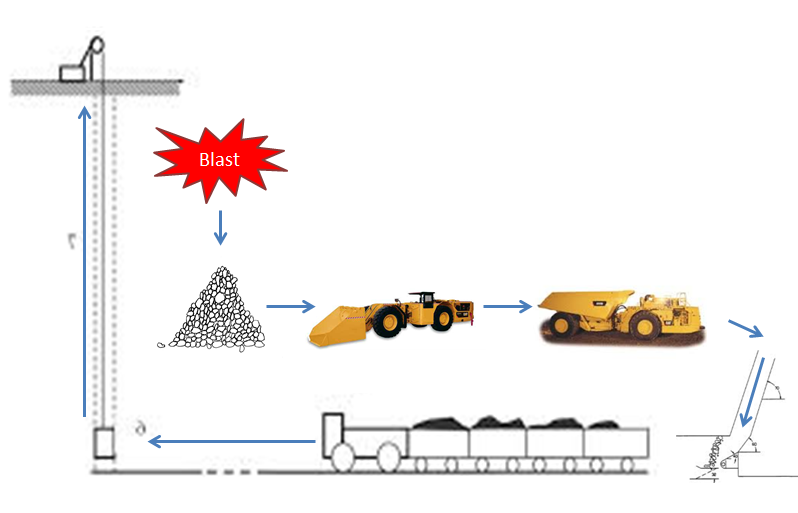
This link in the process can provide a source of opportunity or, if not managed properly, a major source of delay. It is a given that each active mining area will eventually require the assistance of this mobile team to come and take some of their broken rock away and thus, leaving them room to break more. As the breaking (blasting) of rock is arguably the most value added activity in a mine, it is in operations’ best interest to service the mining crew to the highest quality. This is accomplished by providing the miners with as much material as required, when needed, and removing all roadblocks so that the mining cycle can function at an optimal level. Given this great demand on the muck system to keep up with mining activities without allowing a backup of rock anywhere in the process, how does a mine with limited resources deploy these in the most effective manner day in and day out? The challenge of deploying a fixed level of resources effectively with the precision and flexibility to respond quickly to changes in the landscape is amplified greatly in larger mines. Due to the fact that larger operations typically share numerous resources across a vast number of working areas, changing a plan mid-shift can have a significant impact on other areas of the operation. Developing a distance chart could be one of the most valuable tools for your supervisors to use in conjunction with their own level of experience. Here is an example of a distance chart:
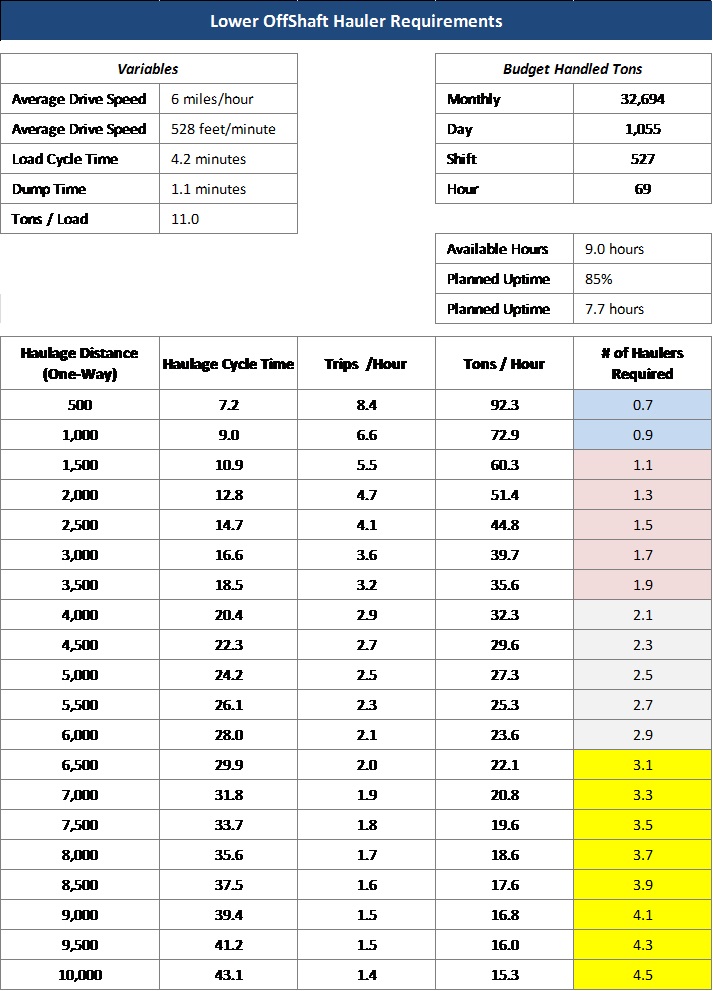
For each active mucking area, it outlines the optimal number of trucks that should be deployed to meet the demand of the mining crew. An important element to understand is the concept of optimal in this equation. The first requirement is that we meet the demand of the mining crew. The second requirement is that we meet this demand at the lowest possible cost because these resources could be required elsewhere. Your formula must take into account the following information: Forecasted Demand – How much rock is the mining crew planning to break? Congestion Factor in the Area – How much traffic, aside from mucking activity, is typically present at the location? Distance – What is the one-way distance from the loading location or mining area to the drop point feeding the muck system? Average Truck Cycle Time – Once a truck is loaded, how long will it take to drive to its dump point, dump the rock, and return? Average Truck Load Time – How long does it take for your LHD loader to fill one haul truck? Current Inventory – How much rock has the mining crew broken since last being “mucked” out? With all of these variables known, a distance chart can be created. When planning daily assignments, a distance chart can be very useful to determine the optimal ratio of trucks to LHD machines. This will allow for any excess resources to be allocated to other crews that are short, other areas of the mine, or other job functions. The use of this tool will not tell your crews where to go, but how many resources will be needed once there.
Obtaining the actual Inventory level can be one of the more challenging pieces of information to obtain. This information must be as real-time as possible and accurate. The actual inventory levels along with site priorities will be the guiding force on what locations will require “mucking” assistance. Distance charting, if used properly, can allow the muck system in a mine to rapidly allocate the right amount of resources to the areas that will yield the most benefit. In an industry where the misallocation of such expensive resources can be so costly, the opportunities to gain are equally as considerable. Distance charting is one of the many useful tools that will encourage opportunity seeking decision-making within your company from the front line supervisor level.