
Continuous Improvement Leads To Cost Savings
Recently, our mining team was asked to conduct a study at a silver mine in South America. The goal of this study was to uncover inefficiencies and implement a continuous improvement program within the mining operation and ultimately reduce operating cost per ounce. This was in response to the rapidly dropping price of silver. Therefore, time was of the essence. The recent volatility of this commodity had the management team at the mining company looking for ways to drastically reduce cost in their operation. Our response was to send a team of eight consultants to Argentina for a twenty-day site visit to conduct an analysis of the opportunities.
Discovering what an organization is currently using to manage its business is one of the most interesting parts of a study. You can quickly tell what is working for them and what isn’t. Usually, we are able to find some elements of a Management Operating System (MOS). Sometimes, more often than not, we discover that a functioning/closed-loop MOS is not in place or being used. This is also an early indication that the management team does not have full control of their operation. They may be measuring performance as a lagging indicator, but are unable to provide any leading indicators to performance trends. Without a closed-loop MOS it also becomes very difficult to make continuous improvement changes to impact performance and to actually measure the impact of those changes. Reporting alone will not allow management to do this. This is the first element we focused on at the silver mine.
Based on the initial assessment, our team and the client developed a realistic target for a reduced cost per ounce. In order to obtain the new reduced cost per ounce target, fifty Continuous Improvement Programs were developed. Continuous Improvement Programs vary in size, but all drive towards the same end goal of efficiency. In this case, the Continuous Improvement Programs developed were all intended to impact the utilization of a given level of resources. It is important to understand how much your resources are capable of without road blocks because this will be your “technical limit”. Although a technical limit is often unattainable, this is what the organization and management should be aiming for. Continuous Improvement Programs work to remove all of the road blocks possible in an effort to bring the operation as close to their technical limit as possible.
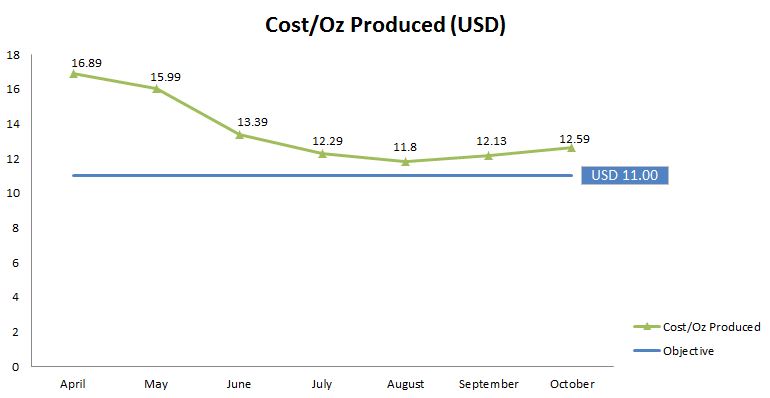
We were onsite to assist in the planning and implementation of each item from start to finish. With such a large number of Continuous Improvement Programs, it was very important to measure the progress towards completing each one and the associated impact they would have on the cost per ounce as they were completed. The financial impact of the changes was measured on a monthly basis.
An important tool to use in conjunction with a Pareto chart is a heat map. Plotting action items on a heat map will allow you to prioritize each item based on two or more distinguishing variables. I typically use “ease of implementation” and “level of impact”. If you rank each item on a numerical scale and graph the results, it will provide a strong visual as to which items should take priority over others. From a results standpoint, you would ideally complete the items that will have a high impact and are easy to implement. This will provide the greatest yield with the least investment (time or otherwise).
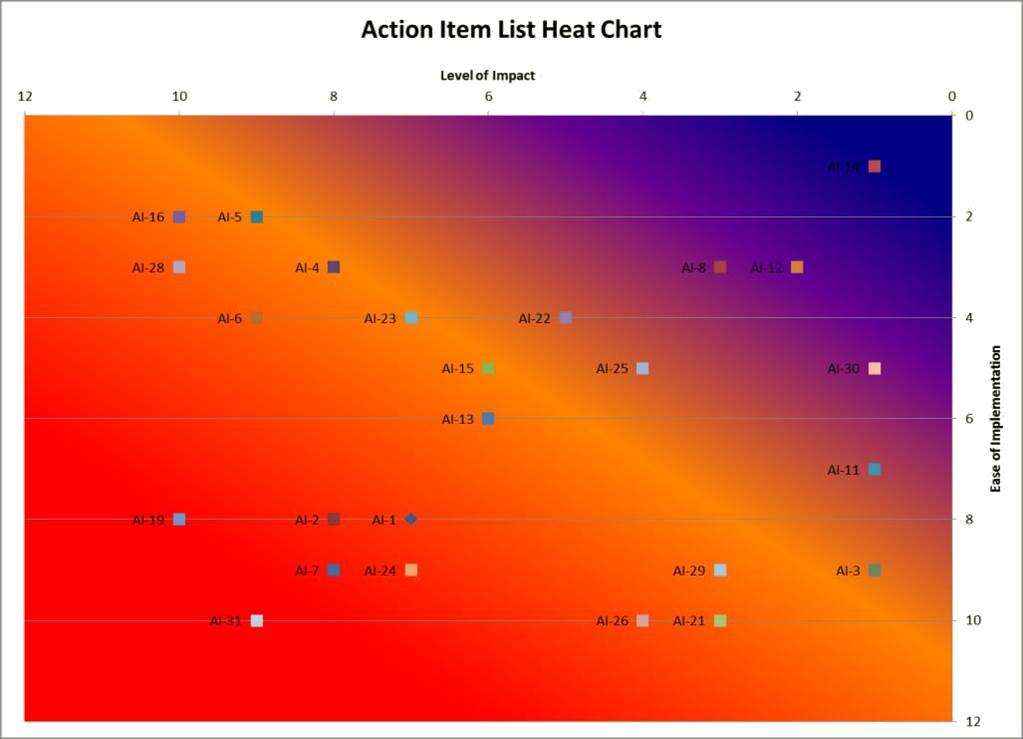
There are several reasons why using this method can be a very effective way of managing action items. Firstly, process owners or champions typically have the most energy at the front end of the process. They are eager to make an impact and want to be a part of the leading charge. Secondly, it is very likely that as time goes on, new issues will arise and thus, more action items added to the list. There may be some new items that should take priority over older ones because of their importance. By maintaining an up-to-date heat map, each item can be analyzed for its individual importance.
What we have often found with a great deal of our clients is that when we arrive, they are not exactly sure what their organization is capable of. As we begin to show bursts of improvement throughout the project and provide tangible results, they begin to see how attainable continuous improvement really is. In addition to the fact that these results are attainable, they also realize that they are the ones taking ownership of it and to various extents, beginning to walk down the path themselves. The management operating system is theirs and could not function without them. At this stage, the behavioral change process has taken effect and this is what will drive your lasting results. This is the part that will bring your organization savings year over year.