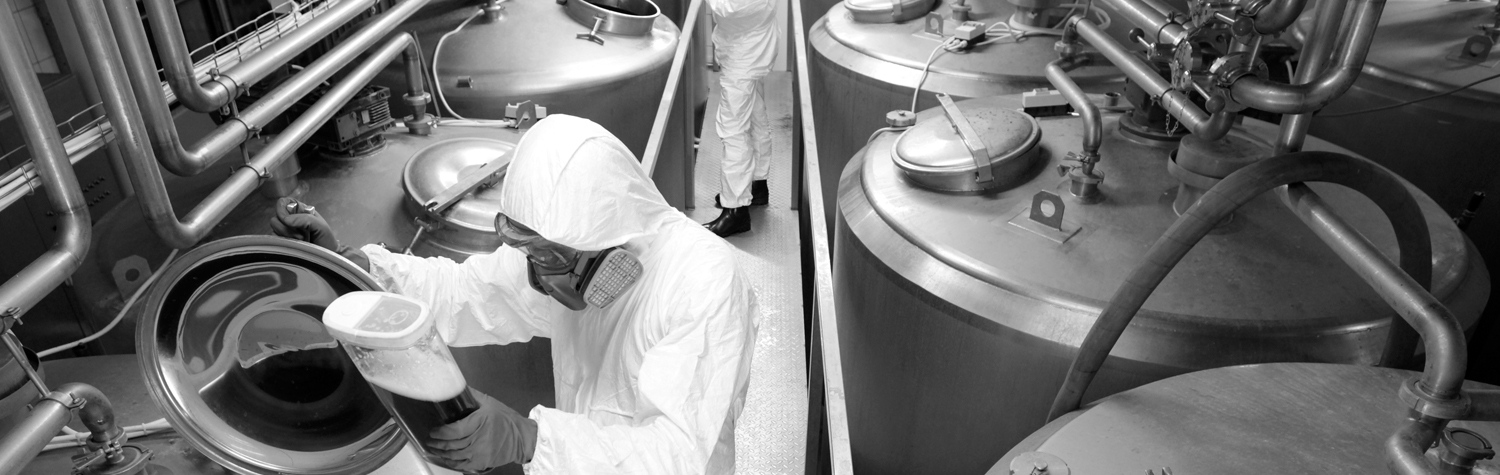
An industry leading provider of advanced metallurgical products and inorganic chemicals used on a daily basis in everything from telecommunication products to the defense industry.
Increasing demand for one of its alloys used in the industries mentioned above was increasing at a rapid rate and the site making the extruded version of the alloy was not able to meet the demand even at a rate of 15 – 20% overtime. A second challenge was to, in the words of the CEO, digitize the process as an example to the rest of the organization.
Working with the local site management team it was agreed that a 5 – 10% improvement in Overall Equipment Effectiveness (OEE) could be attained by applying lean principles to the operation. The first step was to perform a series of Process Mapping and Process Task Analysis exercises to understand what each person in the operation did throughout the production cycle and the prep work that was required before the next production cycle. This analysis led to a realignment of tasks, particularly during the prep cycle and reduced the overall cycle time for 1 production cycle by 3%.
To assist the supervisors, process engineer and lead hands a series of visualization / lean tools were implemented. The cycle time of each production cycle was tracked by the lead hand and when the standard was exceeded, the issue causing the excess cycle time was documented. These issues were reviewed at a daily meeting attended by the operators, supervisor, process engineer, maintenance and a different member of senior management. The issues were prioritized through the use of Pareto Charts and Action Items assigned / followed up on to eliminate the issues impacting on OEE. Performance Boards were installed in the area of the Daily Meeting so the area could track and review how they were improving with small celebrations taking place as certain improved criteria were met (usually simply a free lunch for the crews such as the Area Manager cooking BBQ for all team members).
After final versions of the visual Performance Board and the methodology to track cycle time were finalized, USC supported the organization in implementing a smart factory IOT platform that collected the data automatically and provided “machine truth” to what was happening in the production process. This automated all of the production data gathering / reporting and the updating of the Performance Board.
Furthermore, USC supported the organization in developing a resource crewing guide to determine the appropriate number of employees to have at work so the process could run 24×7, including during lunch and meal breaks. This also eliminated much of the overtime that was increasing costs as employees were transferred into this department from other areas that were experiencing a slowdown in demand. This had an added benefit of keeping experienced employees at the site.
Finally, USC also guided the organization in revamping their maintenance strategy to include more predictive tasks by both production and maintenance. This also led to a change in strategy from “run to fail” to taking an 8 hour maintenance downtime block every 4 weeks.
11%
OEE Improvement
4%
improvement against standard cycle time
7%
increase in availability
Elimination
in overtime expense
$1,700,000
improvement in gross margin
By performing a series of Process Mapping and Process Task Analysis exercises to understand the organization, the team was able to customize a strategy that led to a gross margin improvement of $1,700,000. Also, a combination improvement of standard cycle time and availability increased Overall Equipment Effectiveness by 11%. With the process improvements in place the organization was able to eliminate their overtime expense further reducing overall operational costs.