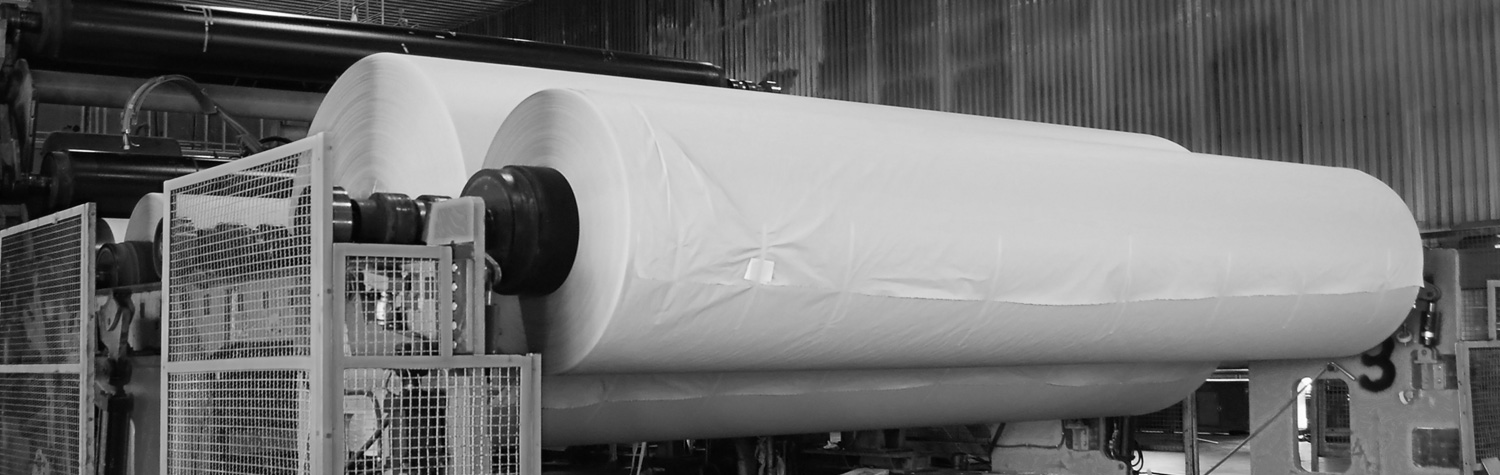
A leading provider of market pulp, paper, and pulp-based consumer products with mills in the U.S. and Canada, and sales and distributions operations across the globe.
While analyzing the cost structure of their fine paper operations, our client discovered that on a volume basis (lbs./ton), the cost of chemicals in its pulp bleaching operation had increased by more than $14,000,000 annually, despite no change in the demands of its customers. We were brought in to help them develop methods for optimizing chemical consumption.
Our initial analysis showed that maximum impact could be gained through data-driven solutions specifically designed for this specific location, but that could also be expanded to the client’s other facilities.
Solution #1 – Introduce Change Management Tools and Techniques
We began by helping the client to implement a series of simple, yet effective tools to be utilized by the bleach plant operators, to begin identifying the reasons for changes in chemical consumption.
Core to these tools were Change Logs and Shift Review Meetings. The Change Log was utilized by the operators to denote every change made to the operation of the process and the reason why the change was made. These Change Logs were used to create Pareto Charts of the reasons for changes to the process, and both the individual Change Log and the Pareto would be reviewed at the end of every shift at a 15 minute Shift Review Meeting.
The intent of the meeting was simply to identify operational issues and assign Action Items to the organization to address the identified issue. This started the creation of a common and standard method of operating and complements the control charting technique mentioned below.
Solution #2: Problem Solving Methodology and Control Charting
We then deployed our internal Six Sigma Master Black Belt to work with and train plant process engineers to implement a problem solving methodology using statistical and non-statistical methods. This helped to identify high impact causes to brightness variability, and that variability resulted in increased use of bleaching chemicals and the higher costs they were experiencing.
An internal cross-functional team was created to perform this work led by the client’s process engineers. They utilized many statistical software tools, techniques and methods including; graphical analysis, sampling techniques, process capability, process mapping and scoring techniques, C&E matrices, Gage R&R, hypothesis testing, statistical process control charting and more.
$2,000,000
in annual Chemical Bleach savings
After addressing the key causes of the cost increase and deploying the appropriate control tools in a four phase implementation roll-out, the variability in the mills’ bleaching operation was significantly reduced while maintaining the quality of the final product.
Additionally, the client now has a newly trained workforce, and a repeatable process that can be used at their other sites to gain additional savings.